Chart Patterns That Predict Gold Price Movements
Chart patterns play a crucial role in financial markets, especially when it comes to predicting gold price movements. As gold continues to attract investors during uncertain economic conditions, understanding how price behaves on charts becomes increasingly important. More importantly, traders who can recognize these patterns often gain a significant advantage.
In this guide, you will learn how chart patterns gold price movements work and why they are essential for traders and investors. In addition, you will discover the most reliable chart patterns, how to use them effectively, and how to avoid common mistakes. By the end, you will be able to apply these patterns confidently in your gold trading strategy.
What Are Chart Patterns?
Chart patterns are visual formations created by price movements on a trading chart. These patterns reflect market psychology and help traders predict future price direction. In other words, they show how buyers and sellers interact over time.
Because markets tend to repeat behaviors, these patterns often appear consistently. Therefore, traders rely on them to identify trends, reversals, and breakouts.
Why Chart Patterns Matter in Gold Trading
Gold is influenced by multiple factors, including inflation, interest rates, and geopolitical events. As a result, price movements can be volatile. However, chart patterns help simplify this complexity.
First, they provide clear signals about potential price direction. Second, they improve trade timing. Finally, they help manage risk by identifying key levels.
Consequently, traders can make more informed decisions instead of relying on guesswork.
Types of Chart Patterns in Gold Trading
Chart patterns can generally be divided into three categories: continuation patterns, reversal patterns, and bilateral patterns.
Continuation Patterns
Continuation patterns suggest that the current trend will continue after a brief pause. Therefore, they are useful for traders who want to follow the trend.
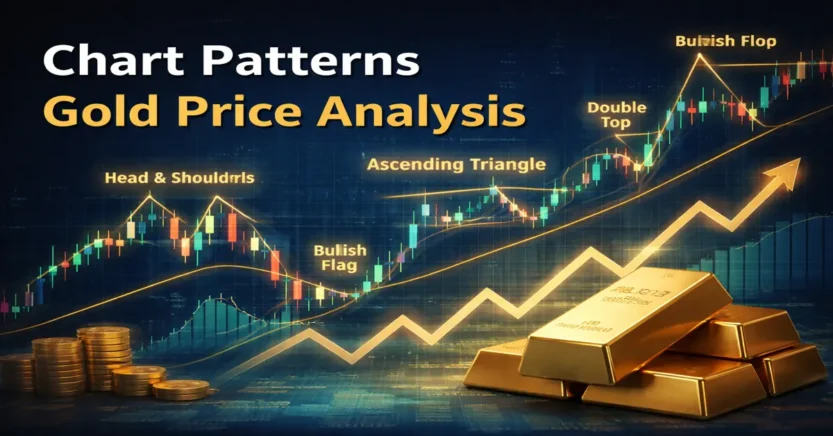
1. Bullish Flag
A bullish flag appears after a strong upward movement. It forms a small downward consolidation before continuing upward.
Because of this, traders often enter positions when the price breaks above the flag.
2. Bearish Flag
Similarly, a bearish flag occurs during a downtrend. After a sharp decline, the price consolidates before continuing downward.
3. Pennants
Pennants resemble small symmetrical triangles. They form after strong price movements and usually indicate continuation.
As a result, traders look for breakouts to confirm the direction.
Reversal Patterns
Reversal patterns signal a change in trend direction. Therefore, they are crucial for identifying turning points in gold price movements.
1. Head and Shoulders
This is one of the most reliable reversal patterns. It consists of three peaks, with the middle peak being the highest.
Once the neckline is broken, a trend reversal is likely.
2. Inverse Head and Shoulders
This pattern indicates a shift from a downtrend to an uptrend. It is essentially the opposite of the head and shoulders pattern.
3. Double Top
A double top forms when price reaches a resistance level twice and fails to break through.
As a result, the price often reverses downward.
4. Double Bottom
Conversely, a double bottom occurs when price tests support twice and then moves upward.
Bilateral Patterns
Bilateral patterns indicate uncertainty, meaning the price can break in either direction.
Symmetrical Triangle
This pattern forms when price converges between two trendlines. Eventually, it breaks out in one direction.
Therefore, traders wait for confirmation before entering trades.
How to Use Chart Patterns in Gold Price Forecasting
To use chart patterns effectively, you need a structured approach.
First, identify the current trend. Without understanding the trend, patterns become less reliable.
Next, locate a recognizable chart pattern. Make sure it is clearly formed.
Then, wait for confirmation. For example, a breakout or volume increase.
After that, set entry and exit points. This includes stop-loss and take-profit levels.
Finally, manage your risk carefully. Never risk more than you can afford to lose.
Combining Chart Patterns with Indicators
Although chart patterns are powerful, they work best when combined with other indicators.
For instance, moving averages can confirm trends. If the pattern aligns with the trend, the signal becomes stronger.
Similarly, RSI helps identify overbought or oversold conditions.
In addition, volume analysis confirms the strength of breakouts.
Therefore, combining tools improves accuracy.
Advantages of Chart Patterns
Chart patterns are easy to learn and widely used. Because of this, they are suitable for both beginners and experienced traders.
Moreover, they work across different timeframes. Whether you trade short-term or long-term, they remain useful.
In addition, they reflect real market behavior, making them practical tools.
Limitations of Chart Patterns
Despite their usefulness, chart patterns are not perfect.
Sometimes, patterns fail or produce false signals. Therefore, confirmation is essential.
Additionally, interpretation can be subjective. Different traders may see different patterns.
For this reason, combining analysis methods is important.
Common Mistakes to Avoid
Many traders make mistakes when using chart patterns.
First, they enter trades too early without confirmation.
Second, they ignore risk management.
Third, they rely on patterns alone without considering market context.
Finally, emotional trading leads to poor decisions.
Therefore, discipline and patience are key.
Best Strategies for Trading Gold with Chart Patterns
One effective strategy is trend following. Traders identify continuation patterns and trade in the direction of the trend.
Another approach is breakout trading. Traders enter positions when price breaks key levels.
Additionally, reversal trading involves identifying patterns like double tops or head and shoulders.
Real-World Application in Gold Markets
In real markets, chart patterns appear frequently. For example, during economic uncertainty, gold often forms strong trends and patterns.
Therefore, traders who understand these patterns can react quickly.
Tips for Beginners
Start with simple patterns like double tops and triangles.
In addition, practice on demo accounts before trading real money.
Furthermore, focus on consistency rather than quick profits.
Advanced Techniques
As you gain experience, you can use multi-timeframe analysis.
Similarly, combining patterns with Fibonacci levels creates stronger signals.
Psychology Behind Chart Patterns
Chart patterns reflect human behavior. Fear and greed drive market movements.
Because many traders follow the same patterns, they often become self-fulfilling.
Future of Chart Pattern Analysis
Technology is improving trading tools. AI and automation are enhancing pattern recognition.
However, human judgment remains essential. In addition, our article on fibonacci gold forecasting strategy guide explains how technical tools work alongside chart patterns gold price analysis.
Conclusion
Chart patterns that predict gold price movements are powerful tools for traders and investors. When used correctly, they provide valuable insights into market behavior.
However, success depends on discipline, practice, and proper risk management. By combining chart patterns with other tools, you can improve your trading strategy significantly.
Finally, professional financial insights and gold market analysis can be accessed on https://www.bloomberg.com.